
Headless Umbraco together with Next.js and SQL Server can, with a certain amount of simplification, be called a distributed system. A user scenario runs through the browser, an SSR frontend to the Umbraco Delivery API or custom endpoints. Inside the CMS, a request may touch the published content cache, HybridCache, Examine/Lucene, media, background distributed jobs, and SQL Server - not every layer on every call. Behavior depends on published content, cache configuration, application state after startup, the specific endpoint, and invalidation after publish.
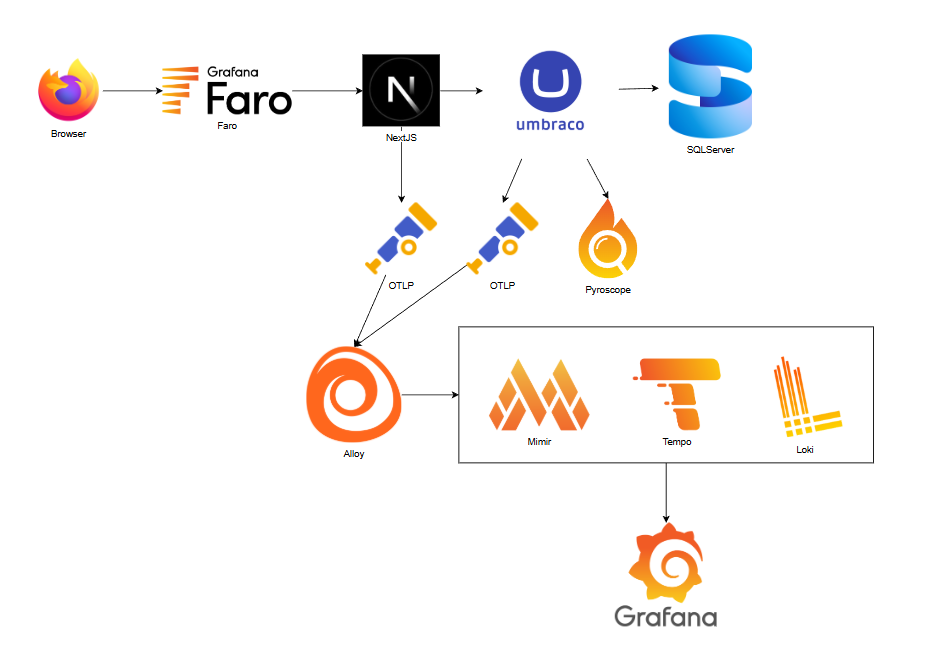
This article is not a button-by-button guide. It explains why you would collect metrics, logs, traces, and continuous profiling for Umbraco, how that is done on the demo stack (Umbraco 17.4.2 + Next.js + Grafana stack), and what you can get from it in practice.
Observability: what it is and why it matters
Let’s accept upfront that observability is not monitoring, ok? Here is a slightly simplified explanation. Monitoring answers questions you baked into dashboards ahead of time: is the pod alive, did CPU hit its limit. Observability is for when the question is not formulated yet: p95 went up after yesterday’s deploy, but there are no errors, the frontend serves a page in 2 seconds while the Delivery API in Postman responds in 80 ms. Where did the other 1.9 seconds go?
Three classic signals cover different aspects of the same story. Metrics say "how much and how fast on average". Logs say "what exactly the service recorded at the moment of processing". Traces say "how the request crossed service boundaries". The fourth signal is continuous profiling: not a one-off dotnet-trace from a laptop, but a sampled view of what the process spent CPU on (and, when needed, wall time, allocations, lock contention) over a time window - including Umbraco background work that may not appear in a single user-request trace.
OpenTelemetry links traces and metrics across services, Serilog ties log events to a trace when an Activity exists, and profiling shows process behavior outside an individual HTTP request. The Grafana stack on this demo is one possible backend for that model, it is familiar to DevOps teams, but you still need your own answers for sampling, retention, data protection, and HA (High Availability).
Choosing the Grafana stack does not mean alternatives are bad. For this demo, priorities were Kubernetes, an OTel-compatible pipeline, and unified correlation of metrics, logs, traces, and profiles in one Grafana Explore.
Aspire is useful as an orchestration and developer-experience layer: it simplifies running dependencies locally and viewing OpenTelemetry signals during development. Telemetry in Aspire is built on OpenTelemetry, apps can export to external production backends. The Aspire Dashboard itself should not be treated as long-term production telemetry storage.
Application Insights is a mature path on Azure, including OpenTelemetry for dotnet and separate scenarios for browser telemetry. Dotnet + Node.js + RUM (Real User Monitoring) combo is not an argument against App Insights by itself. Practical differences: no vendor lock, a single Explore with Loki/Tempo/Pyroscope, ingest-based billing, operational cost, and a technological tie to PromQL/LogQL/TraceQL.
Test stack
Observability on an empty /health is pointless. We need an application worth load-testing and inspecting on the hot path.
In the demo:
- Umbraco 17.4.2, headless, Delivery API, a dedicated full-text search endpoint GET /umbraco/api/search, seed: 100 articles, categories, authors, media;
- Next.js (App Router, shadcn/ui): SSR (Server-Side Rendering), BFF (Backend for Frontend) routes to the CMS;
- SQL Server.
More instrumentation is applied to the read path than to the publish path - this choice is made for simplification, not because the backoffice is considered unimportant for observability.
Deployment is on Kubernetes: apps in demo-services namespace, observability in observability, SQL in sqlserver. Ingress exposes the CMS, frontend, and Grafana over HTTPS.
The observability stack consists of:
| Component | Role |
|---|---|
| Grafana | UI, Explore, trace–log–profile correlation |
| Mimir | Metrics, PromQL |
| Loki | Logs, LogQL |
| Tempo | Distributed tracing, TraceQL |
| Pyroscope | Continuous profiling |
| Grafana Alloy | Collector: OTLP, Faro, Kubernetes logs |
| Grafana Faro | RUM: Web Vitals, errors, client traces (with a separate tracing package) |
Demo vs production for collectors and backends
- Demo: one Alloy gateway, short retention, acceptable loss of telemetry under overload, Loki/Tempo/Mimir may be single-instance, monolithic Tempo is fine for small environments.
- Production: at least two, preferably three gateway replicas, queue/batch/memory limiter, monitoring the collector itself, object storage and retention for Loki, Tempo, Mimir, Pyroscope, a degradation plan when the observability backend is down (the app must not crash, but signals may be dropped under exporter backpressure).
Umbraco instrumentation
CMS instrumentation in the demo: OpenTelemetry for traces and metrics, Serilog with trace_id in JSON, noise filtering on the read path, custom spans for Examine and demo APIs, Pyroscope for CPU profiles on Linux amd64.
Entry point: Serilog and OTel in Program.cs
The host starts with Serilog and immediately wires the observability extension:
// src/umbraco/Program.cs
builder.Host.UseSerilog((context, _, configuration) => configuration
    .ReadFrom.Configuration(context.Configuration)
    .Enrich.With<TraceLogEnricher>());

builder.AddDemoObservability();
TraceLogEnricher is the bridge between logs and Tempo: without it, Loki and traces live in different worlds. Request logging is configured so Information lines are not written for probes and backoffice static assets—otherwise Loki fills with noise and Tempo gets an illusion of a "busy" CMS:
// src/umbraco/Program.cs
app.UseSerilogRequestLogging(options =>
{
    options.GetLevel = static (context, _, exception) =>
    {
        if (!ProbePathFilters.ShouldObserveHttpRequest(context.Request.Path))
            return LogEventLevel.Verbose;

        return exception is not null ? LogEventLevel.Error : LogEventLevel.Information;
    };
});
OpenTelemetry registration: AddDemoObservability
All OTel setup lives in ObservabilityExtensions.cs. Configuration is read from the Observability section in appsettings:
// src/umbraco/appsettings.Production.json — Observability section
{
  "Observability": {
    "ServiceName": "umbraco-cms",
    "ServiceNamespace": "demo-services",
    "DeploymentEnvironment": "demo",
    "Otlp": {
      "Endpoint": "http://alloy-gateway.observability.svc.cluster.local:4317",
      "Protocol": "grpc"
    }
  }
}
service.name and deployment.environment then show up in Mimir, Tempo, and Grafana filters.
Registration in code:
// src/umbraco/Extensions/ObservabilityExtensions.cs
builder.Services.AddOpenTelemetry()
    .ConfigureResource(resource => resource
        .AddService(
            serviceName: options.ServiceName,
            serviceNamespace: options.ServiceNamespace,
            serviceVersion: typeof(ObservabilityExtensions).Assembly.GetName().Version?.ToString() ?? "0.0.0")
        .AddAttributes(new Dictionary<string, object>
        {
            ["deployment.environment"] = options.DeploymentEnvironment,
        }))
    .WithTracing(tracing => tracing
        .AddAspNetCoreInstrumentation(instrumentation =>
        {
            instrumentation.Filter = context =>
                ProbePathFilters.ShouldObserveHttpRequest(context.Request.Path);
            instrumentation.RecordException = true;
        })
        .AddHttpClientInstrumentation()
        .AddSqlClientInstrumentation(sql => sql.RecordException = true)
        .AddSource(DemoTelemetry.ActivitySourceName)
        .AddProcessor(new PyroscopeSpanProcessor())
        .AddOtlpExporter(exporter =>
        {
            if (otlpEndpoint is not null)
            {
                exporter.Endpoint = otlpEndpoint;
            }

            exporter.Protocol = otlpProtocol;
        }))
- ASP.NET Core instrumentation with a filter - Tempo gets Delivery API, /umbraco/api/search, demo API, but not /health, /ready, or backoffice UI paths in the demo.
- SqlClient instrumentation - child spans to SQL Server under the HTTP span. That is evidence of a DB call and operation metadata, not necessarily the full query text.
- AddSource("UmbracoMonitoring") - without registering the source, custom spans from controllers are not exported.
Metrics use the same OTLP endpoint: ASP.NET, HttpClient, runtime (GC, thread pool).
SQL safety in traces
In production you must not enable full SQL statement recording and especially parameters without review. Even parameterized text can contain sensitive data. In dotnet auto-instrumentation, passing SQL statements for text commands is off by default for that reason. For diagnosis, duration, operation name, error status, and a safe query classification are usually enough, raw SQL only after a data policy, redaction, and restricted access to Tempo/Loki.
Noise filter: ProbePathFilters
// src/umbraco/Logging/ProbePathFilters.cs
public static bool IsProbePath(PathString path) =≫
    path.StartsWithSegments("/health")
    || path.StartsWithSegments("/ready");

public static bool IsUmbracoUiPath(PathString path) =≫
    path.StartsWithSegments("/umbraco/lib")
    || path.StartsWithSegments("/umbraco/assets")
    || path.StartsWithSegments("/umbraco/backoffice")
    || path.StartsWithSegments("/umbraco/webservices")
    || path.StartsWithSegments("/umbraco/hub");

/// <summary≫ASP.NET request logs and OTLP HTTP spans for demo-relevant API traffic only.</summary≫
public static bool ShouldObserveHttpRequest(PathString path) =≫
    !IsProbePath(path) && !IsUmbracoUiPath(path);
In Kubernetes, probes hit /health and /ready every few seconds without a filter they dominate traces.
Excluding /umbraco/backoffice from HTTP traces in the demo is not a recommendation for production Umbraco. Publishing, media upload, bulk saves, cache invalidation, and indexing go through the backoffice - traffic that often explains SQL growth and editor UX degradation. In production it is more reasonable to: keep traces on editorial paths, lower sampling for noisy static GETs, retain 100% of errors and slow requests, tag editorial traffic with a separate attribute or service.name.
Custom spans: search and demo endpoints
Delivery API is instrumented automatically. Full-text search in the demo is a separate REST controller SearchApiController (GET /umbraco/api/search) that queries the standard Umbraco Examine index. It is not a Delivery API endpoint but an extra API for the frontend and tests. Load on Lucene/Examine is a separate hot path: inside one generic HTTP span its duration is lost, so SearchApiController creates an internal span with tags for Tempo:
// src/umbraco/Controllers/SearchApiController.cs
using Activity? activity = DemoTelemetry.ActivitySource.StartActivity("ExamineSearch", ActivityKind.Internal);
activity?.SetTag("search.page", page);
activity?.SetTag("search.page_size", pageSize);
// ...
activity?.SetTag("search.query_length", q.Length);
// ...
activity?.SetTag("search.result_count", results.TotalItemCount);
ActivitySource is declared centrally - the name must match .AddSource in OTel:
// src/umbraco/Telemetry/DemoTelemetry.cs
public static class DemoTelemetry
{
    public const string ActivitySourceName = "UmbracoMonitoring";

    public static readonly ActivitySource ActivitySource = new(ActivitySourceName);
}
The pattern is the same: using Activity? activity = DemoTelemetry.ActivitySource.StartActivity(...) plus domain tags (search.*, demo.*). In Grafana you can search TraceQL for { name = "ExamineSearch" } and compare with Delivery API.
Logs: JSON to stdout and trace correlation
Production writes logs to the console as JSON - Kubernetes picks up stdout, the Alloy DaemonSet ships to Loki:
// src/umbraco/appsettings.Production.json — Serilog WriteTo
"WriteTo": [
  {
    "Name": "Async",
    "Args": {
      "configure": [
        {
          "Name": "Console",
          "Args": {
            "formatter": "Serilog.Formatting.Json.JsonFormatter, Serilog"
          }
        }
      ]
    }
  }
]
In the demo, Microsoft.* and broad Umbraco.* are set to Warning. It's a compromise against noise, not an ideal for CMS analysis. A global "Umbraco": "Warning" can hide indexing, cache rebuild, publish notifications, and health transitions. In production, prefer targeted overrides by namespace after reviewing real logs for your version, for example:
"MinimumLevel": {
  "Default": "Information",
  "Override": {
    "Microsoft.AspNetCore.Hosting.Diagnostics": "Warning",
    "Microsoft.AspNetCore.StaticFiles": "Warning",
    "Microsoft.EntityFrameworkCore": "Warning",
    "Umbraco.Cms.Web.BackOffice.Controllers": "Warning",
    "Umbraco.Cms.Infrastructure.BackgroundJobs": "Information"
  }
}
TraceLogEnricher writes canonical trace_id and span_id fields:
// src/umbraco/Logging/TraceLogEnricher.cs
public void Enrich(LogEvent logEvent, ILogEventPropertyFactory propertyFactory)
{
    Activity? activity = Activity.Current;
    if (activity is null)
    {
        return;
    }

    string traceId = activity.TraceId.ToString();
    string spanId = activity.SpanId.ToString();
    logEvent.AddPropertyIfAbsent(propertyFactory.CreateProperty("trace_id", traceId));
    logEvent.AddPropertyIfAbsent(propertyFactory.CreateProperty("span_id", spanId));
    // ...
}
Correlation is not Grafana magic - it is a field in JSON. A request log line after Delivery API contains trace_id. In Explore you open the same trace in Tempo by that id. If you forget the enricher, "Logs for this trace" stays empty while Loki has plenty of logs.
Pyroscope
Traces are one request (or one operation). A CPU flame graph is the distribution of CPU samples over a window. Wall time, allocations, lock contention are separate profile types with different cost and interpretation, do not turn them on without measuring overhead.
The official Pyroscope dotnet profiler in the demo targets Linux amd64, dotnet 6+, the image copies native .so libraries:
# src/umbraco/Containerfile
FROM pyroscope/pyroscope-dotnet:0.13.0-glibc AS pyroscope

FROM mcr.microsoft.com/dotnet/aspnet:10.0 AS runtime
WORKDIR /app
# ...
COPY --from=pyroscope /Pyroscope.Profiler.Native.so /Pyroscope.Linux.ApiWrapper.x64.so /app/
PyroscopeSpanProcessor in OTel links a trace to the profile for a specific span - that is not the same as continuous process-wide profiling, but it complements it.
On a quiet hour with no RPS, flames are often dominated by DistributedBackgroundJobHostedService, locks (SqlServerDistributedLockingMechanism), thread pool waits - a honest picture of CMS background work. Under load, Kestrel, serialization, and NPoco on user requests grow.
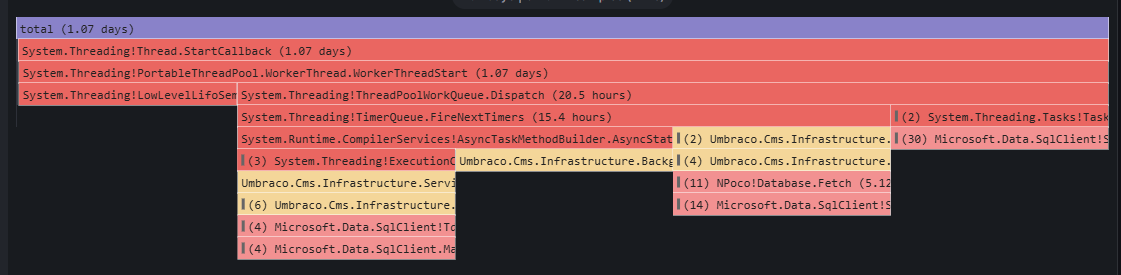
Example flame graph over a short interval with no load.
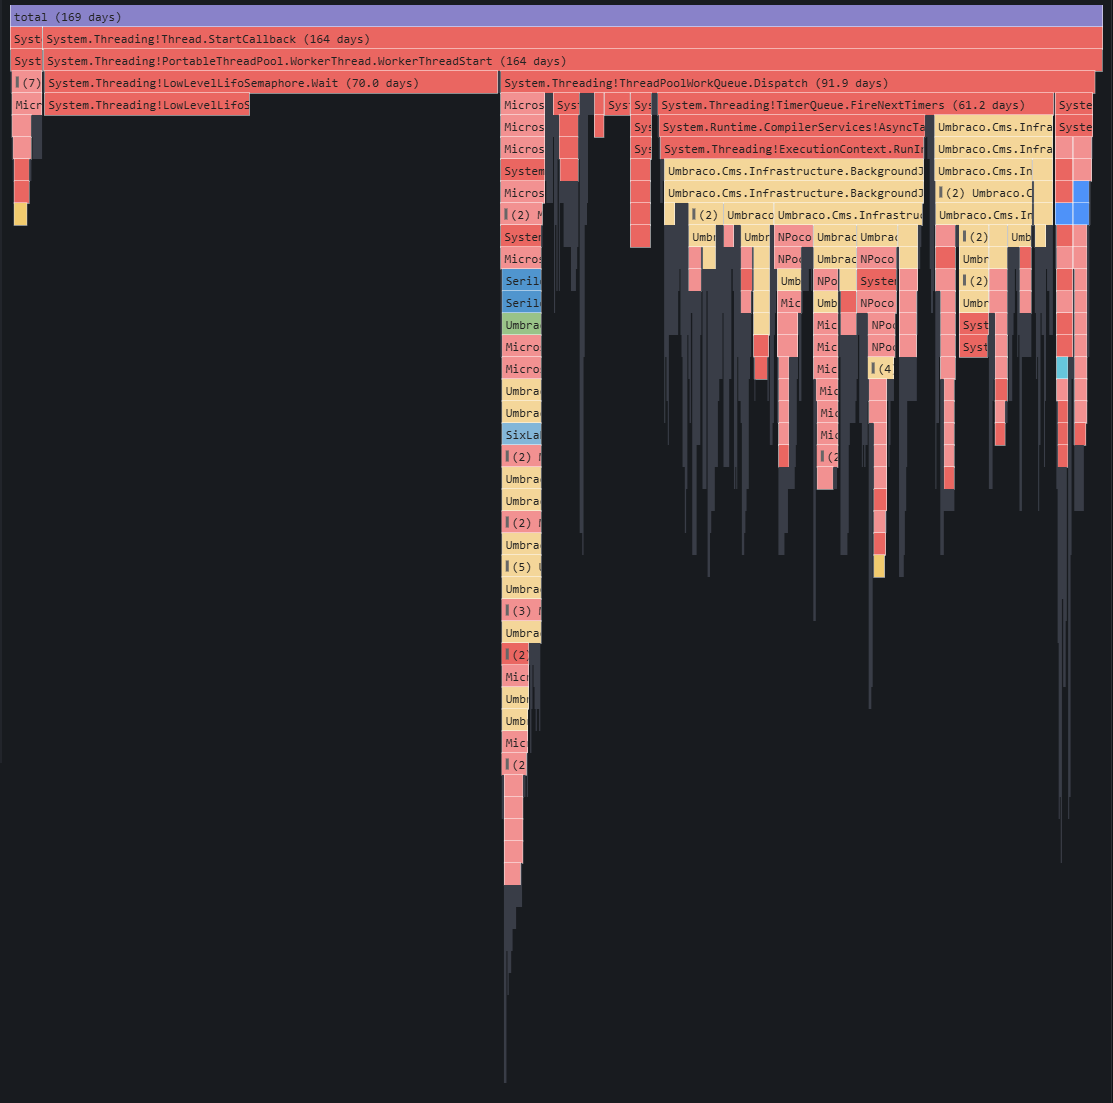
Example flame graph with no load over 24 hours
Correlating browser - SSR - CMS
With OpenTelemetry configured in js, Faro tracing in the browser, and W3C header propagation (traceparent) between SSR/BFF and the CMS, you can tie part of user scenarios into one logically correlated chain. That is not automatic once you "install the SDK".
The chain works only if: the browser creates a trace, SSR preserves or starts context, the Node SDK instruments server-side fetch, Next.js forwards headers to the CMS, the CMS accepts W3C context, sampling does not break the trace. Initial HTML, RSC, hydration, client-side navigation, and BFF often produce different trace shapes - browser navigation trace and SSR trace are not always one trace.
What you get in practice
The ability to follow system behavior at any point on the route.
With successful propagation, Tempo can show a chain like:
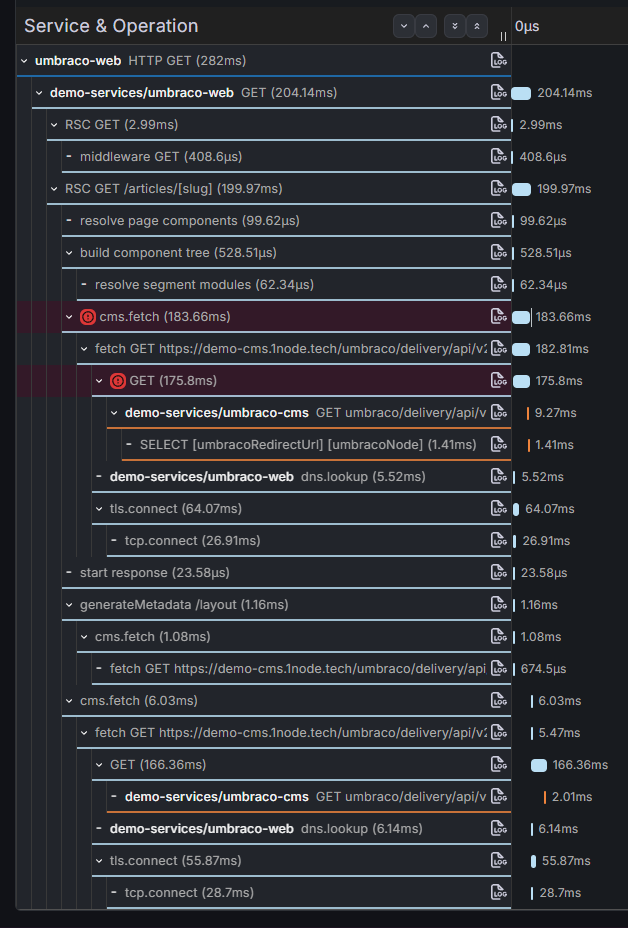
And here is why you should think twice before instrumenting the database: the original query is clearly visible in the details.
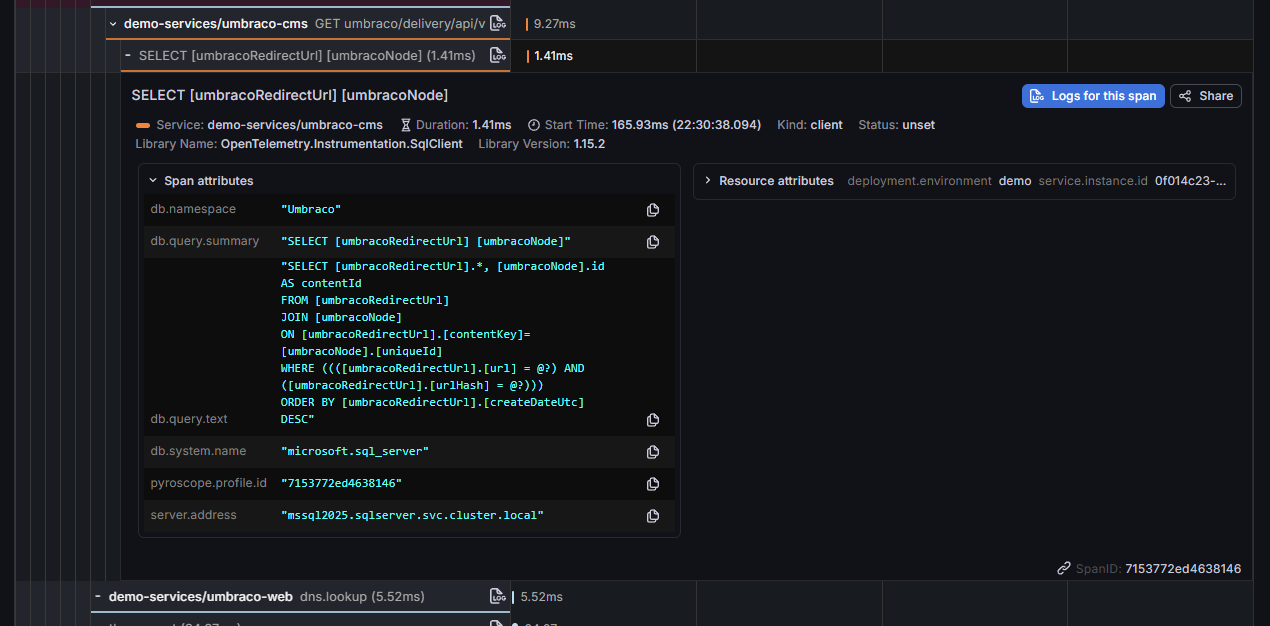
In Loki JSON with the same trace_id in the line body. In Mimir - rate, errors, duration by service.name.
An incident review might look like this: Mimir - when p95 rose, Tempo - which span is long, Loki by trace_id - the Serilog line, Pyroscope in the same time window - CPU vs background jobs.
Four signals answer different questions, together they give a model of the system, not a guarantee that you "see everything always".
Production-grade Q&A
| Level | Question | Signals |
|---|---|---|
| 1 | Is the pod alive, does ingress respond? | K8s probes, /health, /ready |
| 2 | How many errors and what is service latency? | RED metrics in Mimir |
| 3 | Where is time in the Next.js → CMS chain? | Tempo, W3C propagation |
| 4 | What does the CMS do inside a request? | Spans, SQL child spans, logs with trace_id |
| 5 | What does the process do outside one HTTP call? | Pyroscope, background jobs, indexing |
| 6 | What does storage cost and what if the collector fails? | Sampling, retention, HA |
Sampling and telemetry budget
Without sampling and retention, the stack described here is a lab setup. You need: sampling of normal traces, keeping errors and slow traces, ingest limits, retention for Loki/Tempo/Mimir, control of label cardinality in metrics (do not put slug, user id, or search query in labels).
Privacy and security
- do not log content body, search query, or PII unless necessary;
- RUM: restrict origin/CORS for Faro, do not send personal data from the browser;
- raw SQL and parameters - per data policy;
- Grafana (like any service) should sit behind authentication;
- access to editorial traces/logs - by role;
- limit who can see traces of editor operations.
Limits of the demo
- Not every request yields a full web - cms - db trace: batch RSC (React Server Components), broken propagation, separate traces for SSR and browser.
- Backoffice filter and global Warning for Umbraco are read-path demo simplifications, not a production playbook.
- One Alloy gateway is demo convenience - a single point of failure in production.
- Pyroscope and full SQL in traces are deliberate demo trade-offs, not universal defaults.
Instead of a conclusion
Any project under load without observability stays a black box. Metrics, logs, traces, and profiles answer different questions. In the demo they are brought together in Grafana and OpenTelemetry so that part of user requests can be followed from Next.js through CMS internals to SQL and, when needed, into a flame graph - with an understanding of sampling, propagation, the publish path, and the operational cost of the stack.
Instrumentation on the CMS side is not package magic: probe filters, an enricher, AddSource for custom spans, careful SqlClient usage, wrapping jobs in Activity, a native profiler in a Linux image. Those explicit choices turn Umbraco from a black box into a system you can dissect by levels of observation.
Code samples from the article (CMS instrumentation, Next.js and related configs) available in the repository umbraco-observability-playground.